
Top 10 Google Analytics metrics to track user engagement
Site engagement is hailed as a major contributing factor to a successful website, particularly with the attention of online user’s being spread so thin.
Content engagement metrics from free tools, such as Google Analytics, can show you how your website content matches user intent and as a result, profitability.
Before you choose which metrics to track for user engagement, you must decide which are most important for your business. Below are 10 of the most used metrics to track user engagement.
- Page views
- Time on page
- Bounce rate
- Top exit pages
- Pages per session
- Page/Scroll depth
- New users
- New vs. returning users
- Conversion rate
- Abandonment rate
1. Page views
What are page views?
Page views measure each time a page is loaded. This is tied to users in that each page view hit is tracked against a user, however, if a user leaves a page and returns again, this is a repeated view – which is also counted. Page views should always be analysed in conjunction with unique page views.
In isolation, page views can be misleading, but they can provide a solid indication that search engines are driving traffic to your site.
For example, you could have high page views but low unique page views, so you know that users are being directed to your website but it may indicate that users are navigating around your site struggling to find the content they want.
How to track page views
Behaviour > Overview
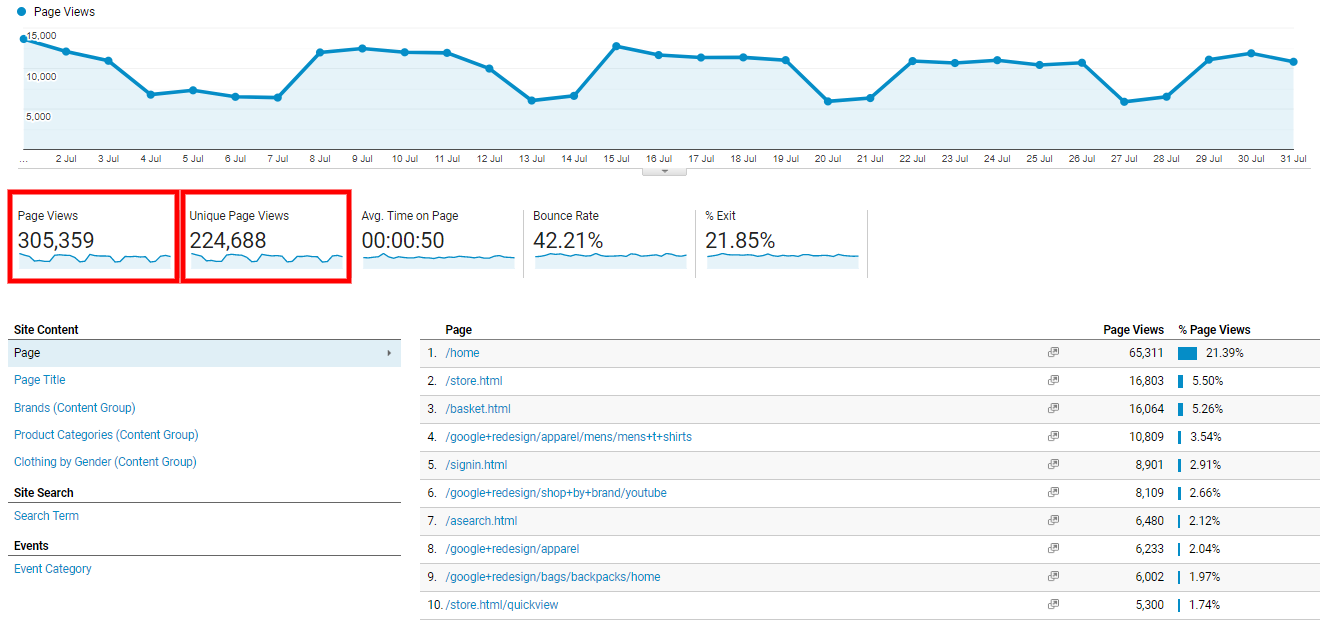
Google Analytics can be used to track page views over a certain period.
As a general rule of thumb, when your page views increase, any changes that you have recently made may be a contributing factor to the improvement.
How to improve page views
Page views can be increased in the following ways:
- Provide a good user experience: there are three elements to consider when it comes to providing a good user experience; speed, accessibility and design.
Speed is critical as most users will abandon a website that doesn’t load in two to three seconds. You can use various website speed testing tools, such as Pingdom, GTMetrix, Google Page Speed Insights or Google Analytics Page Speed Suggestions (Behaviour > Site Speed > Speed Suggestions) to identify tasks that will reduce loading times above three seconds.
Accessibility involves having well-structured, understandable and easily accessible content. Fixing a problematic content structure could be as simple as creating new content categories and arranging it in a more relevant way.
Design is what draws people in, but with a caveat. Typically, a more elaborate design requires more assets to be loaded thus slowing down site speed. This is a fine balancing act that can be mitigated through good coding practices.
- Give your visitors relevant content to click on: as the saying goes, “Content is King”. Create content with a purpose and that’s worthwhile for your business’s target audience to consume.
- Use internal linking: branch out to related posts. Additionally, consider breaking longer posts into multiple threads.
- Promote your website: Shamelessly advertise your website on social media, use online paid advertising channels and request guest bloggers.
2. Time on page
What is time spent on page?
Time spent on page is the amount of time a user spends on a single page. It can also be interpreted to identify how interesting users find your content.
There are two factors to consider here:
- Micro view: time spent on page
- Macro view: the average session duration or average time spent on site
A blog post with an ideal length of about 2 100 words, with an average reading rate of between 200 and 250 words per minute would take at least 10 minutes to read for a highly engaged user. If your average session duration is only one minute, then you know that there is no possible way for them to read even one post.
What is the average session duration?
Average Session Duration takes all the sessions over a specific time period, adds them together and divides them by the total number of sessions.
A session tracks a user’s entire visit to your site so it will include time spent on multiple pages whereas the time spent on page only tracks the view time for a single page.
How to track time spent on page
Behaviour > Site Content > All Pages
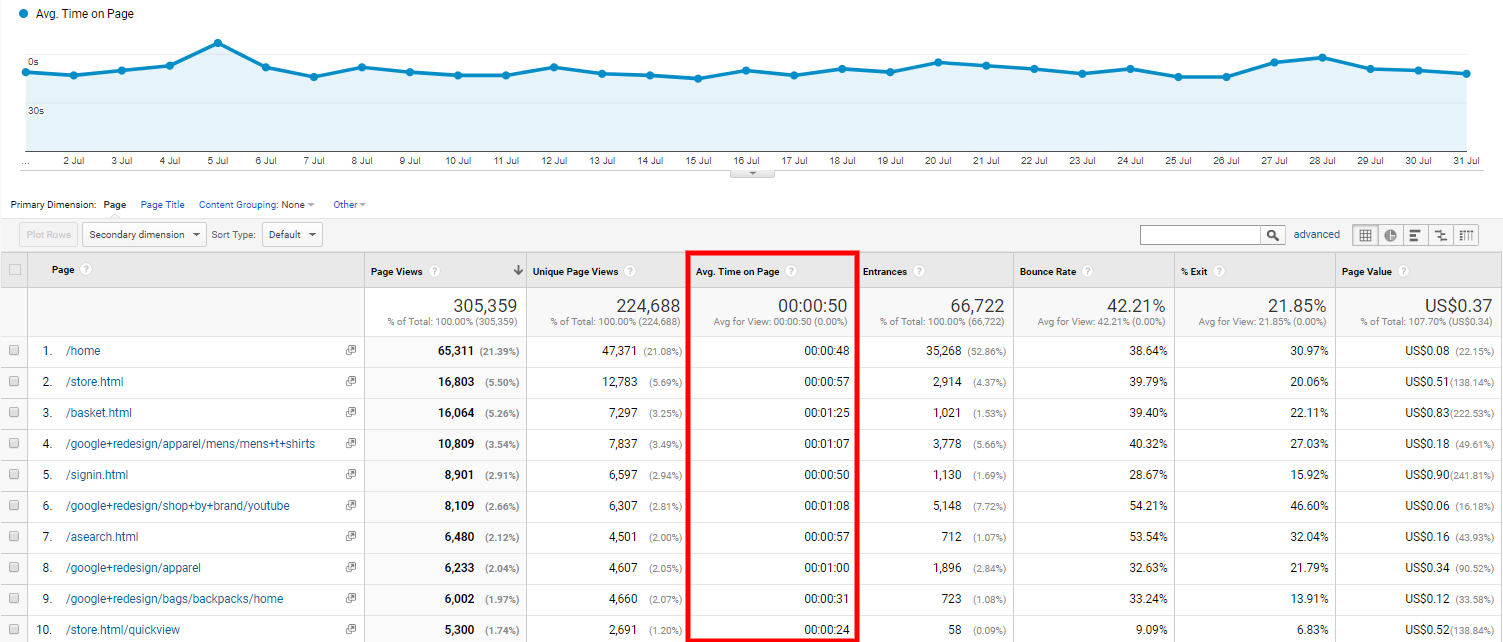
Google Analytics can track time spent on a page, but be warned that when you’re tracking average time spent on pages, it’s better to look at a longer time period where you can truly get aggregate data to provide a more accurate result.
How to track average session duration
Audience > Behaviour > Engagement
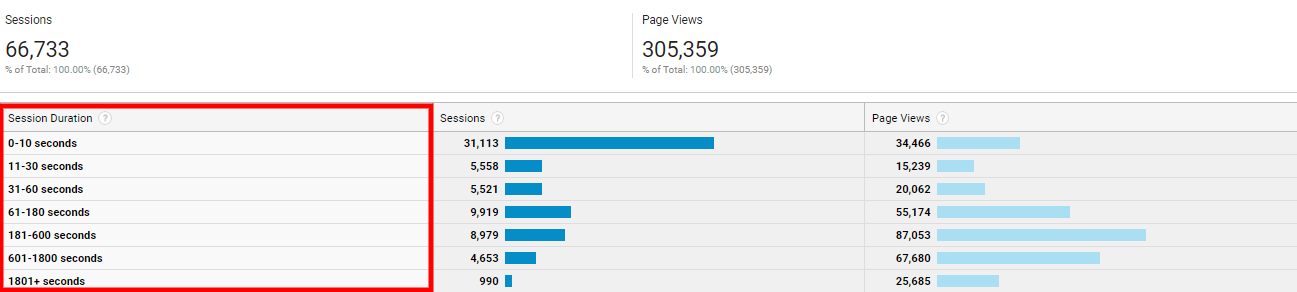
This view allows you to see how many sessions lasted what length of time, by drilling down further into specific pages you can begin to see which pages users are spending more time on and which pages require attention.
How to improve the time spent on page
Key insights for optimising your time spent on page can be found in Google Analytics and it’s typically better to look at data over the course of a year when making these improvements.
Behaviour > Content Drilldown > Advanced Filtering Options > Filter by Unique Pageviews > number to match against
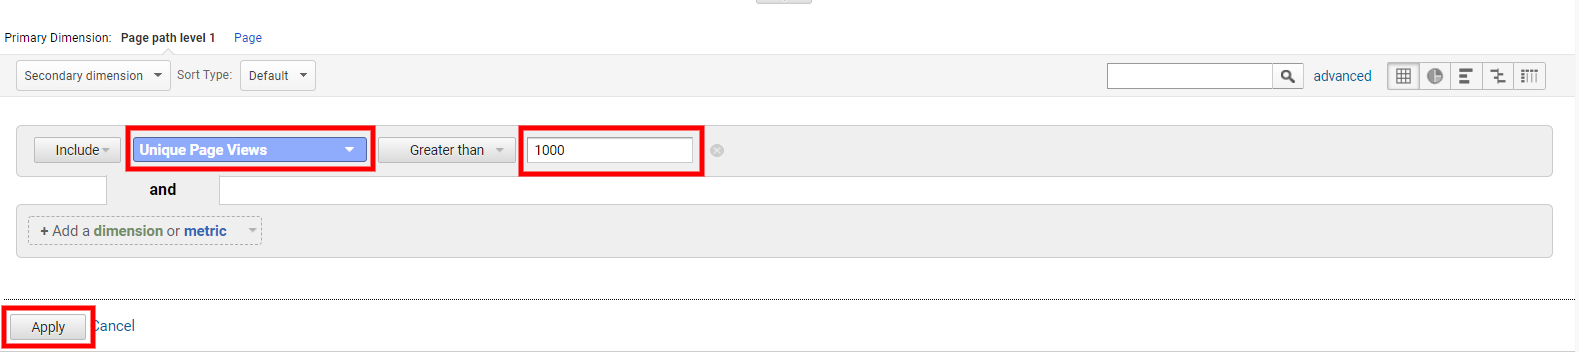
You’ll see that the average time spent on page changes.
If you know that your average blog post is about 500 words, and your readers spend between one and two minutes reading them, then you’re in a good range. But if they spend less time on the page, analyse what could be making them exit prematurely. Is it your writing style? Does your page take a long time to load? Is the content misleading?
How to improve the average session duration
Session duration provides a broader overview of your site so it is harder to optimise. This deals with the overall user experience on your site which can be a challenging task to improve. Some elements to consider include:
- Content relevancy: does the content meet the need of your target audience?
- Site structure: how easy is it to find the relevant information a user would be looking for?
- Call-to-action: provide users with prompts on what action you want them to take.
3. Bounce Rate
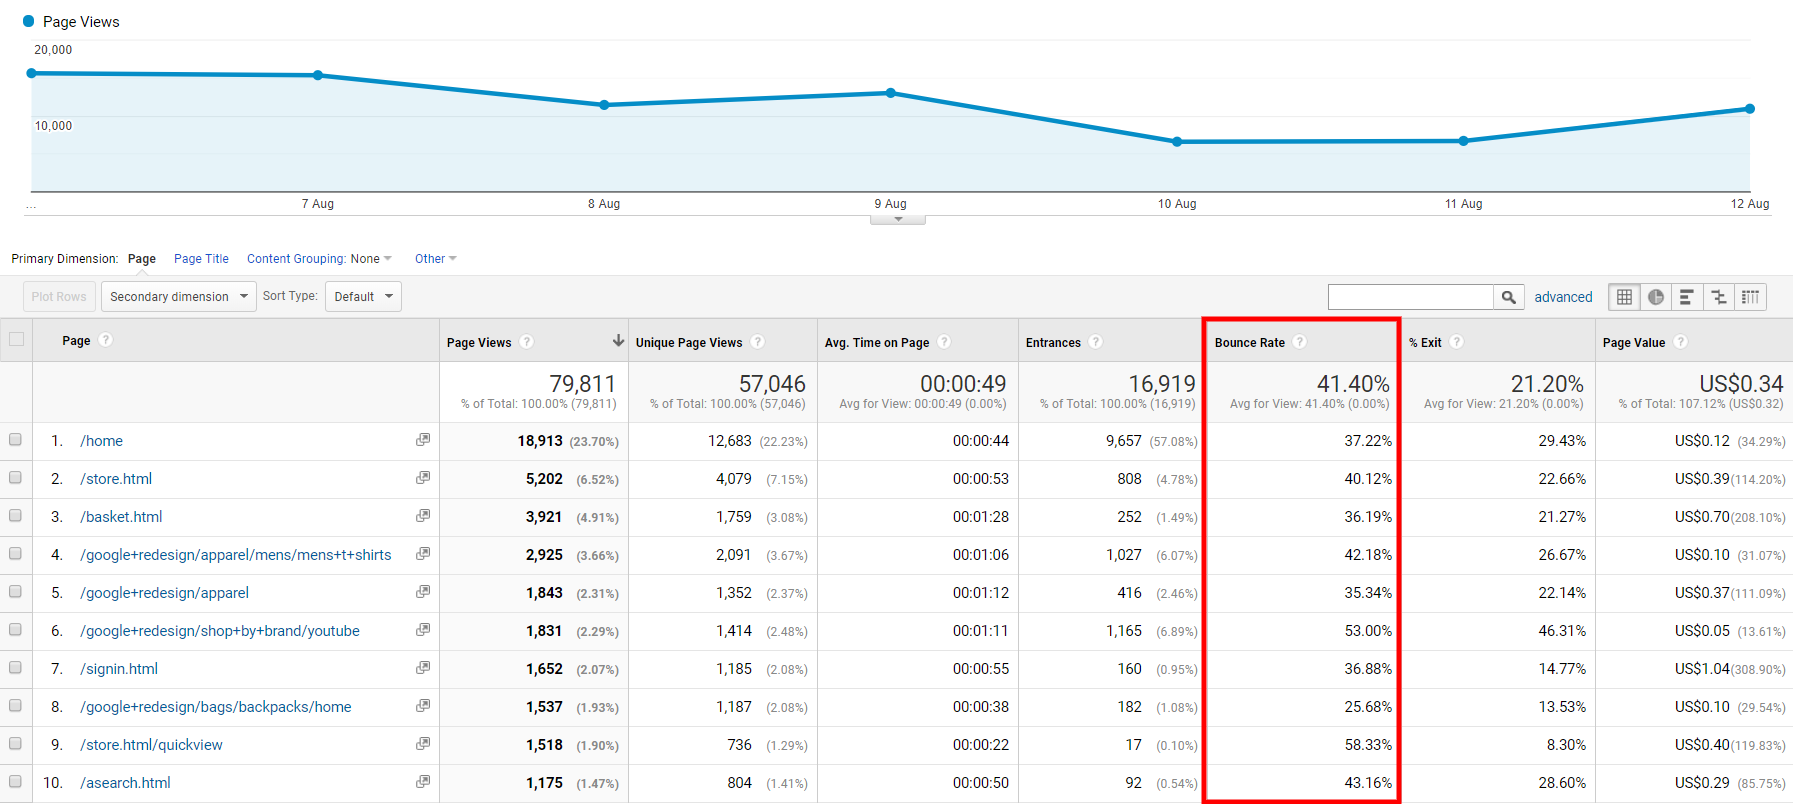
What is bounce rate?
Bounce rate is the rate of users who leave your website after only viewing one page. You’ll find that the bounce rate is often inversely proportional to the average session duration because the longer users are engaged, the less likely they are to bounce.
A common trend observed is that the bounce rate is inversely proportional to the average session duration: as the bounce rate increases, the average session duration decreases.
Reasons for a high bounce rate include:
- The purpose of the page is unclear.
- The content on the page is not what was expected.
- The content is not interesting enough to keep users on the page.
If your traffic numbers are high but your bounce rate is also high, your audience engagement will be low. Search engines will take notice and lower your website ranking because it doesn’t match user intent.
How to track bounce rate
Behavior > Site Content > All Pages
How to improve bounce rate
A sure-fire way to improve a high bounce rate is to look at the pages that have a good bounce rate, identify what elements drive users to convert and replicate that.
Some specific ways you can lower bounce rates:
- Be clear about your page purpose: create clear concise and most importantly helpful content with clear instructions on what to do next.
- Provide a great user experience: no pop-up ads, audio, or automatic video playback.
4. Top Exit Pages
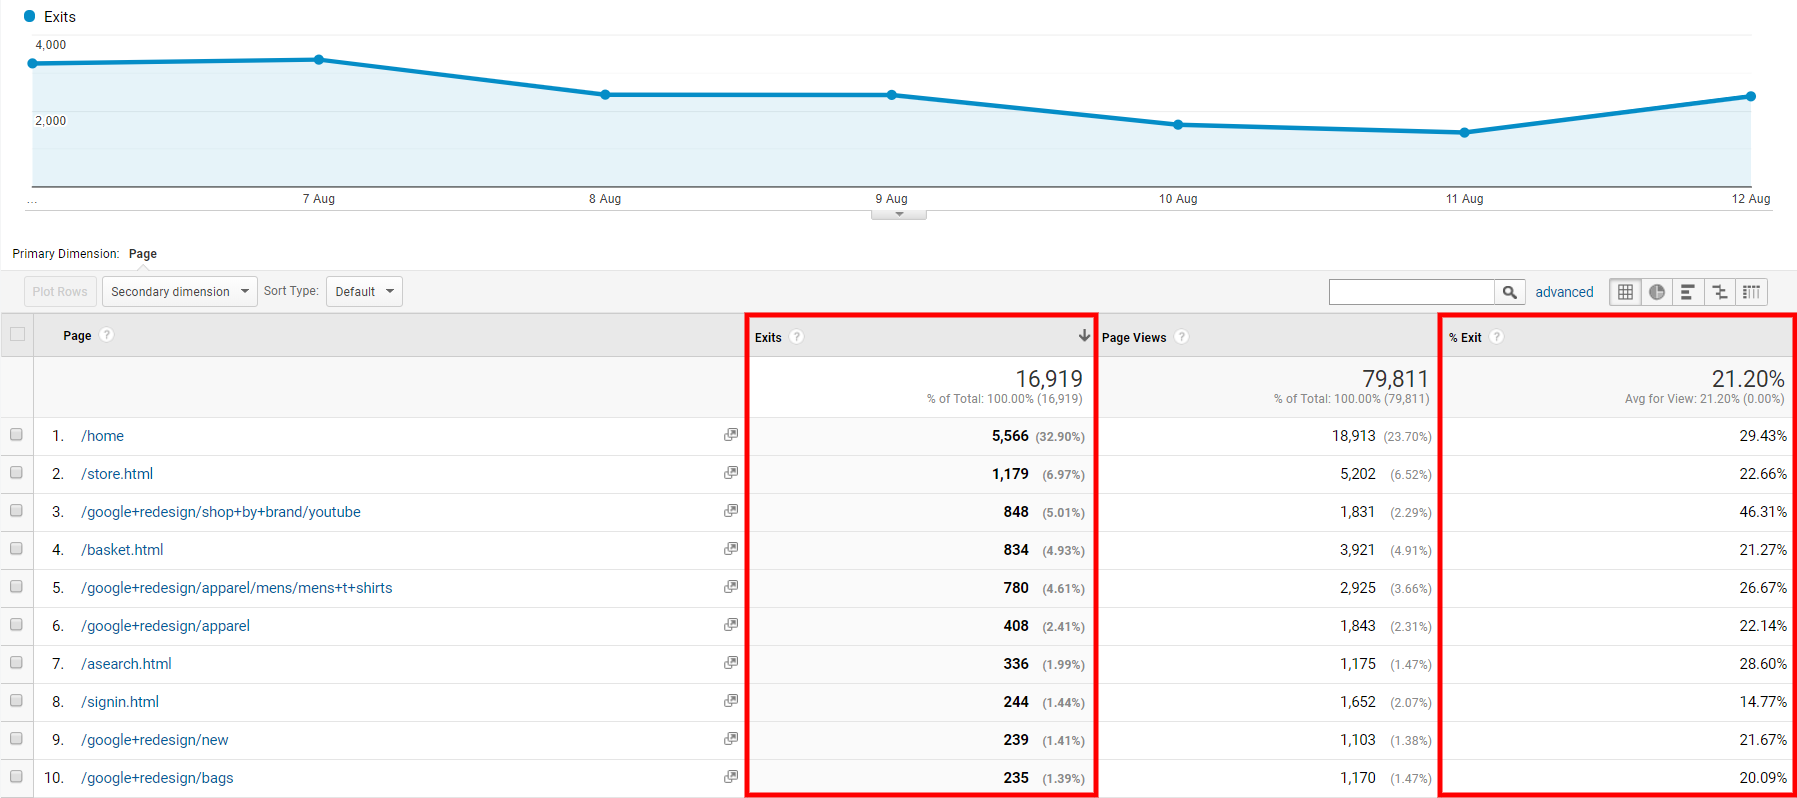
What are the top exit pages?
Exit pages are the last page a user views before leaving your site. There are two kinds of exit pages; those that are designed to be exit pages and those that aren’t.
For example, after completing an action (eg. submitting a contact form), a user is presented with an endpoint for that action (a thank you page) that is designed to conclude their visit. If, on the other hand, you have a clearly defined buyer journey and you notice users dropping off in the middle of the journey, then you should take steps to optimise that page to encourage the next step.
High exit rates on non-exit pages can be caused by:
- A lack of information.
- Bad website semantics.
- Unclear next step or call-to-action on a page.
How to track top exit pages
Behavior > Site Content > Exit Pages
How to improve top exit pages
To optimise your exit rates, you need a clear idea of what your buyer journey should be and what the exit pages should be. The same bounce rate reduction methods can be applied to your exit pages.
- Your page purpose and call-to-action should be clear.
- Provide a great user experience.
5. Pages per Session
What are pages per session?
Pages per session is another good metric to track user engagement. It’s related to your bounce rate in that a lower bounce rate will give you a better number of pages per session. Users who browse more pages in a session are likely to be more engaged by your content.
How to track pages per session
Acquisition > All Traffic > Channels
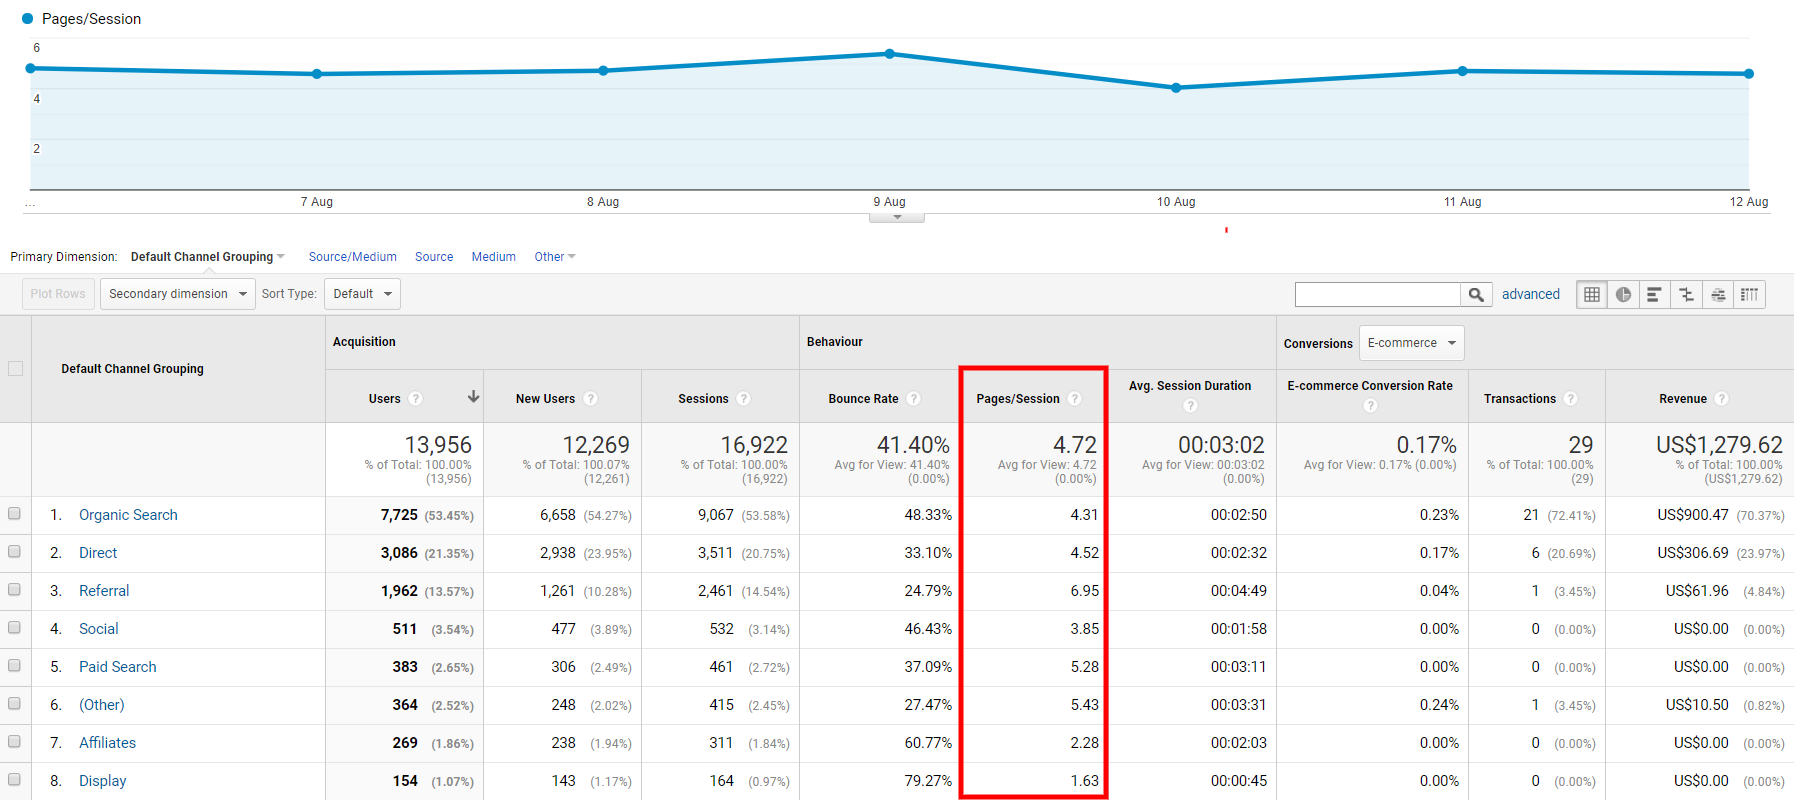
A high number of pages per session must be looked at in conjunction with time spent on pages. If your number of pages per session is high but your time on page is low, it could indicate that users are navigating around your site trying to find the relevant information or looking for what to do next.
How to improve pages per session
The best way to optimise your pages per session value is to provide a clear path for users with interesting content and call-to-actions that guide the user to an endpoint for that action.
6. Page/Scroll Depth
What is page/scroll depth?
Page depth measures how far users dive into your pages as an estimation of how far down the page they read. This can indicate two things, namely, readability and interest. If users find your content difficult to read or boring, they will not read the entire page.
How to track page/scroll depth
This feature is not built into Google Analytics, you will have to install a 3rd party plugin on your website to enable this feature.
After installing the plugin, page depth metrics are sent to your Google Analytics property using events. This is measured using percentages (25%, 50%, 75% and 100%), absolute pixel depth and identifies the elements where users stop scrolling.
Another option to track pixel depth (or if you aren’t using WordPress) is to use Google Tag Manager. Like the plugin, you can track depth as a percentage and absolute pixel depth.
How to improve page/scroll depth
Understanding why users aren’t scrolling as far down the page as you’d like requires a fair understanding of user experience principles and critiquing your content. Is there something happening at a particular drop off point? Does the content need some work at that point? By analysing these user engagement metrics, you should be able to work out why users are dropping off.
7. New Users (previously unique traffic)
What is a new user?
New user is a metric that tracks how many times different individuals visited your site within a set reporting period.
How to track new users
Audience > Overview
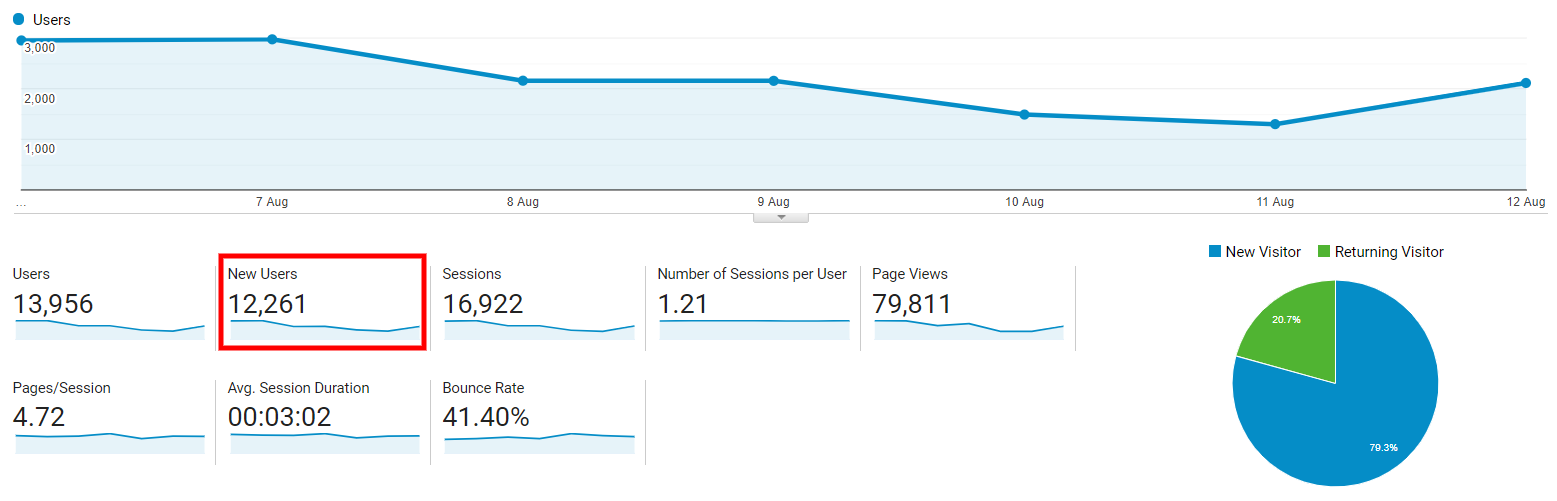
When a user visits a website, Google Analytics assigns a client ID that is stored in a cookie in the browser. This client ID is unique to every browser and not IP address, if a website is visited using another browser, Google Analytics will recognise this as another unique user.
Analysing the user metrics will tell you the number of new users entering your site. Tracking your new users over time can be useful in telling you how successful your advertising campaigns are at reaching users.
How to improve new users
Familiarise yourself with your current audience and use that information to branch out into related audiences. Promoting your website is another way to generate new users but be careful of the effect on your existing user base.
8. New vs. Returning Users
What are new vs. returning users?
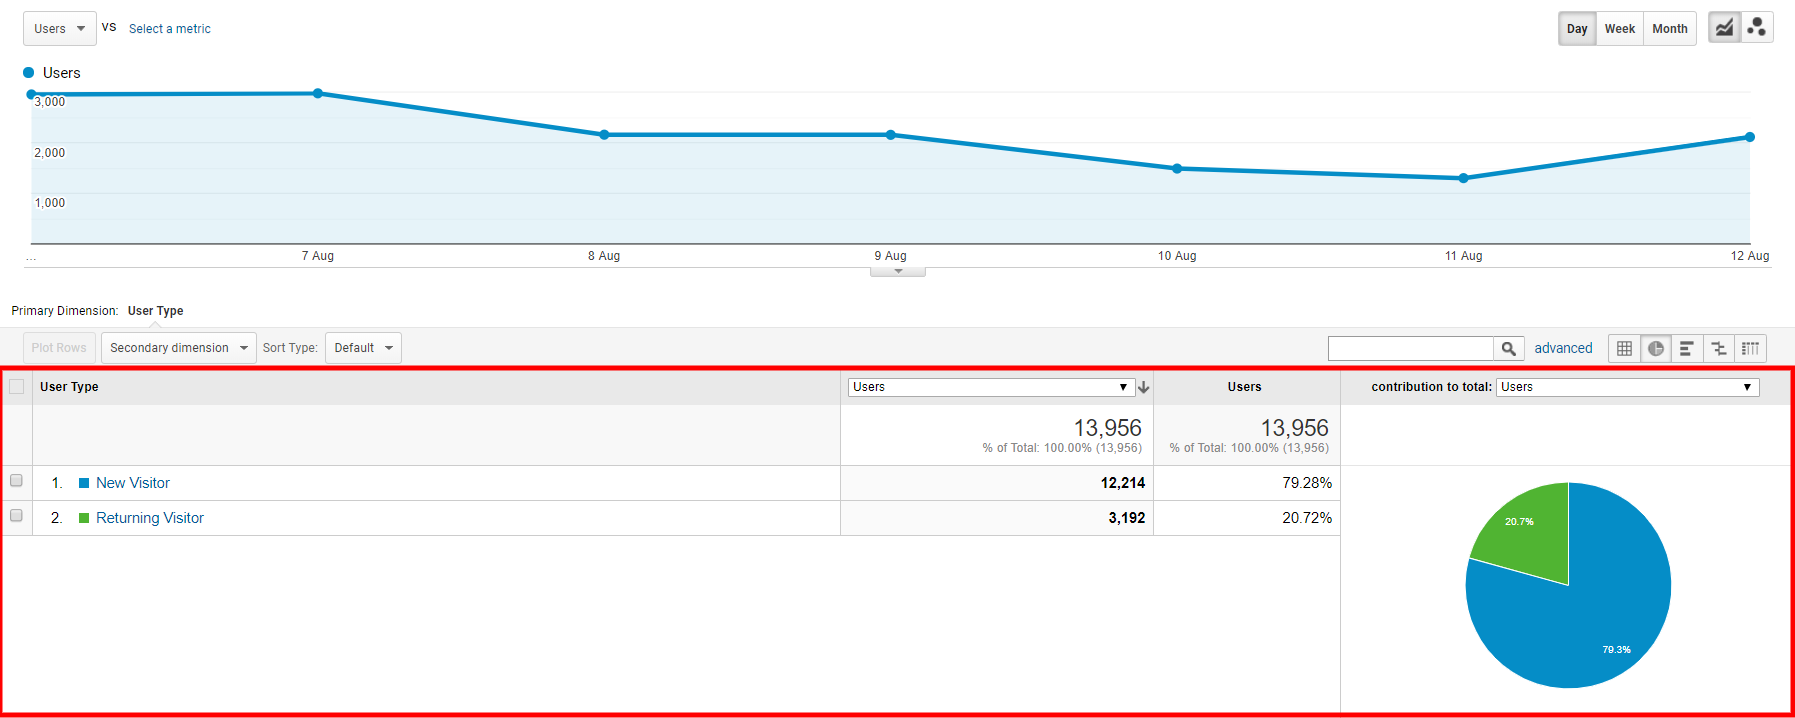
New vs. returning users is a metric in Google Analytics that is presented in a pie chart and can quickly give you a visual representation of where your user base lies. Either in faithful returning users or the more casual user.
How to track new vs. returning visitors
Audience > Behavior > New vs Returning
How to improve new vs. returning visitors
The new vs. returning user ratio can be indicative of the success of your website advertising campaigns. Consider the following different forms of advertising and how the user ratio shows results about them:
- Display advertising, if successful, will increase new users.
- Organic search tends to result in an even distribution of new vs. returning users.
- Visitors directed from email marketing campaigns have already signed up for your mailing list which is indicated by the number of returning users.
- Direct traffic users navigate to your site by directly typing the URL or navigated from a bookmark so they should be returning users.
Segmentation along these channels is always helpful. For example, if your returning users are converting more often, consider a campaign to drive more interactions from these users. Alternatively, if your bounce rate is high from your new users, it could indicate a problem with your user experience or content.
9. Conversion Rate
What is conversion rate?
The conversion rate is the ratio of users who visit your website compared with those who complete desirable actions – like completing and sending a contact form.
How to track conversion rate
Conversions > Goals > Overview
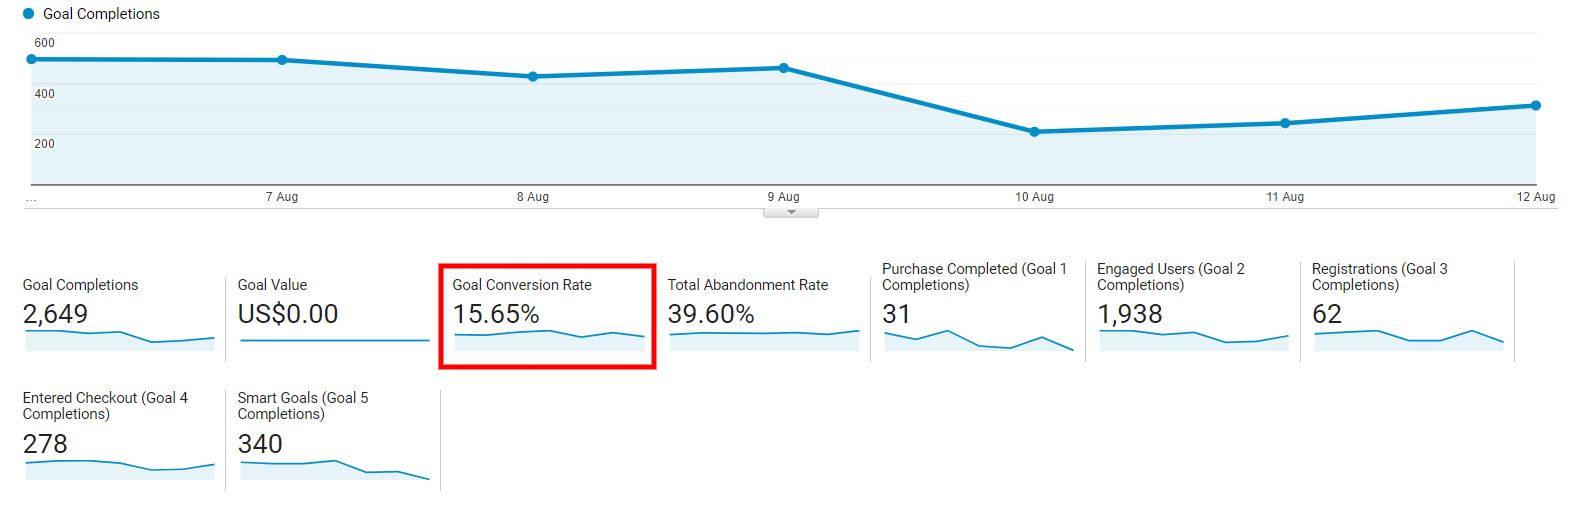
There is an entire section in Google Analytics dedicated to reporting on conversions. This can be used to track conversion rates by channel, which is exceptionally useful. For example, if you run a Facebook campaign driving user subscription on your website and you see that the conversion rate from the campaign is good then you can be assured that the advertising spend is justified.
How to optimise conversion rate
Conversion rate optimisation is all about making the conversion experience on your website seamless for users. The great thing about conversion rate optimisation is that it’s all about taking the traffic that you already have and funneling them into conversion paths so that you can start doing it no matter the volume of traffic your site gets.
It starts with measuring your analytics before optimisation, implementing various A/B testing tools and finally, selecting the variant – or combination thereof – that gives you the highest conversion rate.
10. Abandonment Rate
What is abandonment rate?
Cart abandonment rate (or just abandonment rate) is the ratio of initiated online purchases to completed purchases. This is a useful metric for eCommerce website owners as they that can be tied directly to profitability.
How to track abandonment rate
Conversions > Ecommerce > Shopping Behaviour
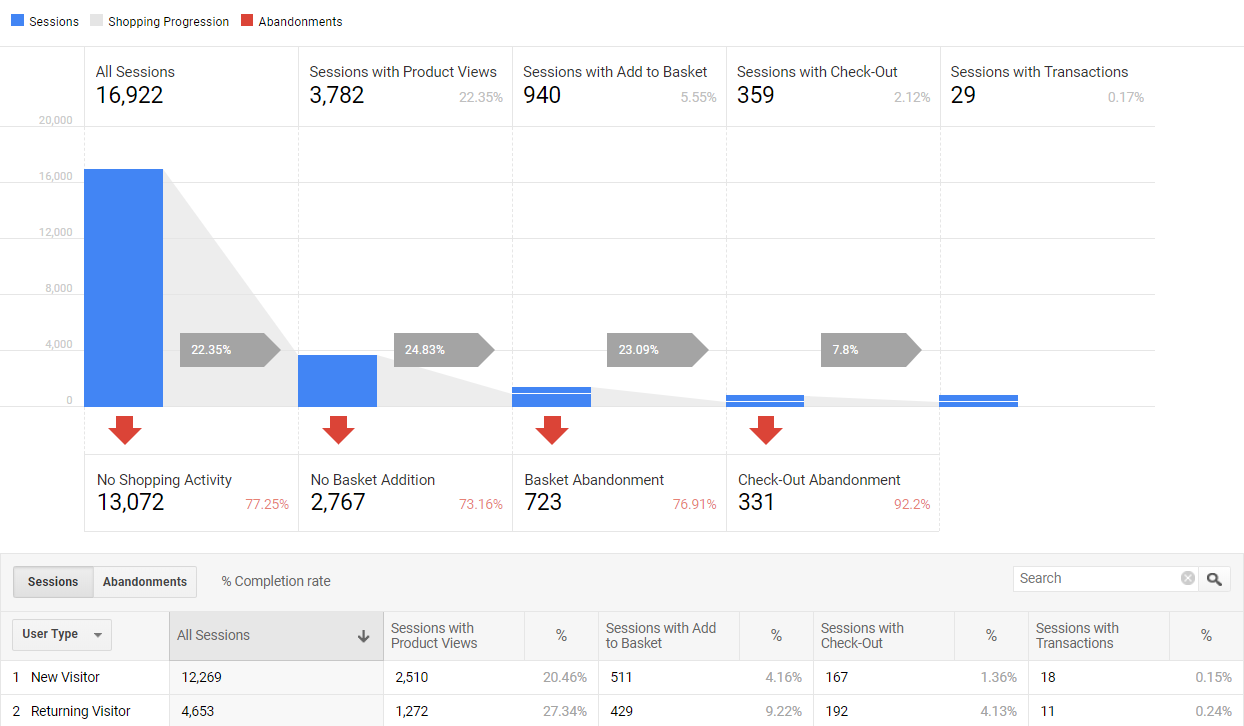
You’ll see information on customers that:
- did not add a product to their cart,
- added a product to their cart,
- abandoned a cart with products in it,
- abandoned a cart at checkout.
Tracking where users abandoned their cart along with other metrics can be useful for identifying why they might have abandoned their purchase. For example, if the cart abandonment rate for users on mobile devices is unusually high on step two of your checkout process, it may mean that your checkout process is too arduous on mobile devices. Try testing the purchase process yourself and see where you get frustrated by the experience.
How to improve abandonment rate
Improving abandonment rates is a two-pronged approach;
- improve the shopping experience before the sale,
- and remarket to customers by sending reminders of their incomplete transaction.
BEFORE
To ensure that users don’t abandon carts before the final checkout process, always make sure that your site runs quickly, is secure and shows what phase they are in during the checkout process. Additionally, if you can make shipping costs known before the checkout screen, that can only be a good thing. Research shows that most carts are abandoned because of unplanned checkout fees on the checkout page.
AFTER
Send abandoned cart emails. Even send a few at different time intervals starting with the first at one hour after abandoning a cart. While sending these, create a time-sensitive offer to encourage your users to complete the transaction.
Final Thoughts
All user engagement metrics can be tracked with Google Analytics and from there, you can gear your site towards increasing user engagement. Higher user engagement often translates to greater online presence and profitability.
Start by creating content with a clear purpose that users find interesting and then look towards optimising the technical aspects of your website and you’ll see an upward spike in user engagement. Need some assistance with improving user engagement and driving conversions? Contact us to see how we can help you.